Power of the Purse: The Contributions of Hispanic Americans
Date: February 17, 2020

Every day, Jose Brito Bueno does special work, providing life-improving services to thousands of seniors and people with disabilities. Through the company he founded, WeCare, some of the most vulnerable residents of New Jersey and Pennsylvania are able to receive the precious in-home health care they need. This is no easy task, and central to WeCare’s ability to do this work is its staff. The vast majority of his 215 employees work as home health aides, a job that is vital yet physically taxing. Many of WeCare’s home health aides are Hispanic immigrants — hailing from countries like the Dominican Republic, Honduras, Guatemala, Nicaragua, and Mexico — who work side by side with American workers. Due to the difficulty of the job relative to its pay, finding committed, caring workers is a challenge. “Their labor is eminent. I use the word eminent because without them we couldn’t go as far as we’ve gone, because of the dedication and the care they provide,” says Brito Bueno.
Brito Bueno is himself intimately familiar with the kind of hard work that many immigrants do when they first arrive in the United States. An immigrant from the Dominican Republic, he came to the United States at the age of 18, and within a week of arriving his father’s corner store burned down. To help rebuild, Brito Bueno worked a series of low-paying jobs and eventually put himself through college and started WeCare, seeing an opportunity to help those in need. Since its accreditation in 2009, WeCare has helped thousands of homebound Americans. Yet without his Hispanic and immigrant workers, none of it would have been possible. “I’d be in trouble,” he said.
Hispanic Americans like Brito Bueno, who are adding to the economy and improving the well-being of Americans, can be found across the United States. Taken together, the contributions of the nearly 59 million Hispanic Americans living in the United States today add up to significant economic and electoral clout.
“Hispanics live everywhere . . . and, obviously, Hispanics buy everything,” says Felipe Korzenny, founder of the Center for Hispanic Marketing Communications. For the United States, “it’s a double benefit,” he says. “Because, one, they work and produce things that other groups don’t like to, then on top of that they add to the consumption base.”
To shed more light on the economic impact of Hispanic Americans, New American Economy (NAE) looked at U.S. Census data from the 2017 American Community Survey. The data shows that Hispanic Americans earned more than $1 trillion and paid more than $250 billion in taxes in 2017 alone. Beyond that, they continue to fill critical workforce gaps in labor-short industries such as agriculture, construction, and healthcare. Hispanic Americans, and particularly Hispanic immigrants, also continue to start and own their own businesses at higher rates than the rest of the population. Last, given the upcoming 2020 election, we find that Hispanic eligible voters now make up considerable shares of the electorate, accounting for as much as 30 percent of eligible voters in several states.
“The Power of the Purse: The Contributions of Hispanic Americans” finds:
- In 2017, there were almost 59 million Hispanic Americans in the United States. Just over two-thirds, or 39.2 million, were U.S.-born Hispanics, while there were 19.6 million Hispanic immigrants. Combined, they made up 18.1 percent of the overall U.S. population, making them the largest non-white ethnic group in the country.
- The growth among U.S.-born Hispanics was particularly strong. U.S.-born Hispanics accounted for nearly 90 percent of growth in the Hispanic population in the United States between 2010 and 2017. The number of U.S.-born Hispanics grew by 22.8 percent, from 31.9 million to 39.2 million.
- Hispanic households hold considerable earning and consumer power. In 2017, Hispanic households earned more than $1 trillion. This allowed them to pay more than $252.2 billion in taxes, including $165.9 billion in federal income taxes, as well as $86.3 billion in state and local taxes. After taxes, Hispanic households held more than $780.7 billion in spending power.
- Today’s most recently arrived Hispanic immigrants are significantly more well educated than those who were recently arrived in 2010. While only 15.1 percent of Hispanic immigrants who had arrived between 2005 and 2010 held at least a bachelor’s degree, 28.5 of Hispanic immigrants who arrived between 2012 and 2017 did.
- Hispanic immigrants are more likely to be entrepreneurs. Almost 12 percent of all Hispanic immigrant workers worked for their own business in 2017, making them 24.5 percent more likely to have their own business than the overall U.S. population. There were a total of almost 2.3 million Hispanic entrepreneurs in the United States in 2017.
- Between 2010 and 2017 the number of eligible Hispanic voters increased by more than 7.3 million. In 2017, there were more than 28.8 million Hispanic eligible voters, a 34 percent increase from the 21.5 million Hispanic eligible voters there were in 2010. The number of U.S.-born eligible voters in particular grew from 16.1 million in 2010 to 21.7 million, an increase of more than 5.5. million people.
- In some states, Hispanics are capable of wielding considerable electoral power. While nationwide, Hispanic Americans make up 12.5 percent of eligible voters, in some states they make up an even more significant share of the electorate. In New Mexico, 42.7 percent of all eligible voters are Hispanic. They make up 30.0 percent and 29.8 percent of eligible voters in California and Texas, respectively, and almost 1 in 4 eligible voters in Arizona.
- Voter turnout rate is high among registered Latino voters. About 80 to 83 percent of registered Hispanics vote in presidential elections. For example, 12.7 million Hispanics, or 83 percent of registered Hispanics, voted in the 2016 presidential election, an increase of 1.5 million from 2012. About 26.7 million Hispanic Americans were of voting age, meaning 11.4 million Hispanics were eligible to vote but did not register. Meanwhile, nearly a million more Hispanics Americans turn 18 every year.
Population Growth and Economic Clout
Today, Hispanics form the largest minority group in the United States and are the second-fastest growing group in the United States behind Asian Americans. In 2017, the Hispanic population of the United States stood at 58.8 million, representing an increase of 16 percent, or more than 8 million, from just 2010.
U.S.-born Hispanics saw especially strong population growth. Between 2010 and 2017, the number of U.S.-born Hispanics grew by 22.8 percent, or more than 7 million, going from 31.9 million to 39.2 million. Meanwhile, the Hispanic immigrant population grew modestly, growing by 4.4 percent over the same period, reaching 19.6 million in 2017. This difference in growth rates means that most Hispanics in the United States today are not immigrants but rather U.S.-born. In fact, by 2017, the overwhelming majority — two out of three — Hispanic Americans were born in the United States.
Figure 1: Population Change for Selected Groups and the U.S. Population, 2010-2017
| 2010 | 2017 | Growth Rate, 2010-2017 | |
| Hispanic | 50,729,570 | 58,837,861 | 16.0% |
| —U.S.-Born Hispanic | 31,912,465 | 39,185,124 | 22.8% |
| —Foreign-Born Hispanic | 18,817,105 | 19,652,737 | 4.4% |
| Asian American and Pacific Islander | 17,983,511 | 22,613,591 | 25.7% |
| African American | 38,926,493 | 41,420,756 | 6.4% |
| Total U.S. Population | 309,349,689 | 325,719,178 | 5.3% |
Although fewer additional Hispanic immigrants have been coming to the United States than in the past, Hispanic immigrants are settling in new destinations across America. While the number of Hispanic immigrants in the United States increased by 4.4 percent overall during this time period, in some states like North Dakota, Montana, South Dakota, and Maine, the Hispanic immigrant population increased dramatically (see Figure 2). Even several heavily populated states, including Pennsylvania, Florida, Massachusetts, Michigan, and Virginia, saw their Hispanic immigrant populations grow by at least twice the national rate.
Figure 2: The Hispanic Immigrant Population, 2010 and 2017
Surprisingly, we find that several states with large populations of Hispanic immigrants, including California, Arizona, New Mexico, Georgia, and Illinois, saw decreases in their number of Hispanic immigrants between 2010 and 2017 even as the overall number of Hispanics continued to grow. In fact, every state in the Union saw their number of total Hispanics, regardless of nativity, increase between 2010 and 2017, further reflecting the overall shift of the Hispanic American population from a largely immigrant population to a largely U.S.-born one. Similar to the growth patterns among Hispanic immigrants, the total Hispanic population grew at the fastest rate in North Dakota, South Dakota, Montana, Maine, and New Hampshire. Each experienced an increase of some 40 percent or more between 2010 and 2017, more than twice the national growth rate for Hispanics of 16 percent. In the two states with the largest Hispanic populations, California and Texas, the number of Hispanic Americans grew by just 9.8 percent and 17.1 percent, respectively, between 2010 and 2017.
Figure 3: The Hispanic Population in the United States, 2010 and 2017
Florida was another state that saw a significant increase in its Hispanic population, which increased by 1.1 million people, including 401,227 Hispanic immigrants, between 2010 and 2017. Florida also serves as a prime example of how communities benefit from influxes of new residents and workers: Between 2010 and 2017, payroll job growth in Florida outpaced the nation as a whole. Credit for this growth, according to a 2017 report by the Florida Legislature’s Office of Economic Development and Growth, was due to Florida’s strong positive net migration, which they called the “state’s primary engine of economic growth, fueling both employment and income growth.” Florida’s growth was fueled largely by its Hispanic population, which was responsible for half of the state’s growth between 2010 and 2017, despite making up just 25.6 percent of the state’s population in 2017.
To local experts, the connection between economic growth and Hispanic American population growth is clear. “Immigrants of all types, whether international or domestic, have been an important driver for Florida’s economy,” says Sean Snaith, Director of the Institute for Economic Forecasting at the University of Central Florida College of Business, in Orlando. “It’s a mutually beneficial situation: Those jobs need to be filled.” In the Orlando metro area, 30.5 percent of the total population is Hispanic, and one of its fastest growing counties, Osceola County, saw its Hispanic population increase by 65 percent from 2010 and 2017. As home to Disney World and other popular attractions, much of the Orlando metro area’s economic growth has been fueled by the tourism and construction industries, as well as burgeoning professional services and technology sectors. Between November 2017 and November 2018, the Orlando metro area saw the strongest growth in non-farm employment of any metro area in the United States, at 4.8 percent.
Figure 4a: Top Countries of Birth of Hispanic Immigrants, 2010 Figure 4b: Top Countries of Birth of Hispanic Immigrants, 2017
Country
Number of Immigrants
Share of All Hispanic Immigrants
Country
Number of Hispanic Immigrants
Share of Hispanic Immigrants
1. Mexico
11,658,122
62.0%
2. El Salvador
1,193,603
6.3%
3. Cuba
1,101,038
5.9%
4. Dominican Republic
868,235
4.6%
5. Guatemala
785,351
4.2%
6. Colombia
638,932
3.4%
7. Honduras
510,460
2.7%
8. Peru
446,454
2.4%
9. Ecuador
424,274
2.3%
10. Nicaragua
242,737
1.3%
Other Countries
947,899
5.0%
TOTAL
18,817,105
Country
Number of Hispanic Immigrants
Share of Hispanic Immigants
1. Mexico
11,141,609
56.7%
2. El Salvador
1,372,231
7.0%
3. Cuba
1,275,931
6.5%
4. Dominican Republic
1,147,909
5.8%
5. Guatemala
938,315
4.8%
6. Colombia
785,020
4.0%
7. Honduras
634,447
3.2%
8. Peru
452,837
2.3%
9. Ecuador
441,324
2.2%
10. Venezuela
338,505
1.7%
Other Countries
1,124,609
5.7%
TOTAL
19,652,737
Our analysis also shows that there is increasing diversity within the Hispanic population. Today, Hispanic immigrants come from a greater range of countries across the Caribbean, Central America, and South America than they did at the start of the decade. Historically, Hispanic immigration has been dominated by Mexican immigrants, with Mexicans making up the vast majority of all Hispanic immigrants in the United States for decades. Today, while immigrants from Mexico still make up just over half of all Hispanic immigrants in the United States, the number of Mexican immigrants in the United States actually decreased between 2010 and 2017 by 4.4 percent, or more than 516,000 people. At the same time, the number and share of Hispanic immigrants from other countries increased, most significantly from Honduras, the Dominican Republic, Colombia, and Venezuela (see Figure 4b).
Hispanic Americans in the Labor Force
Figure 5: Labor Force Participation Rate and Employment Rate, 2017
| Labor Force Participation Rate | Employment Rate | |
| All Hispanic Americans | 67.4% | 94.8% |
| —Hispanic Immigrants | 68.7% | 94.0% |
| U.S. Average | 63.2% | 94.8% |
The numbers also show that Hispanics are more active in the labor force than the U.S. population as a whole. This means that they are more likely to be of working age — between 16 and 65 — and are able and willing to work. In 2017, while the overall labor force participation rate in the United States was 63.2 percent, it was 67.4 percent for Hispanics and 68.7 percent for Hispanic immigrants. Hispanic immigrants also saw higher than average rates of employment. While the employment rate nationwide was 94.8 percent, it was even higher for Hispanic immigrants, at 95.5 percent.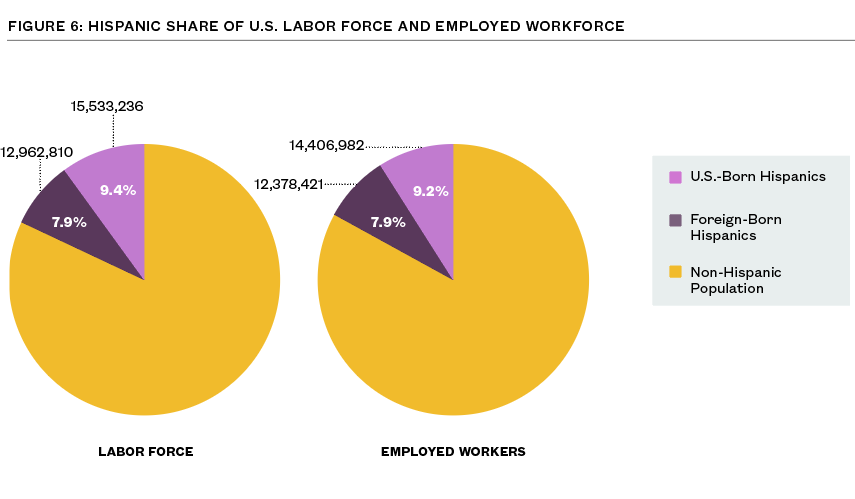
The most recent data shows the educational attainment levels overall for Hispanics. While Hispanic Americans are still more likely to lack a college degree than the overall U.S. population, the most recent wave of Hispanic immigrants is starting to shift that dynamic.
Compared to Hispanic immigrants who arrived between 2005-2010, the share of those who arrived between 2012-2017 and had a high school diploma was 18 percentage points higher. Meanwhile, the share of those with a bachelor’s degree in the 2012-2017 cohort was nearly double that of their earlier counterparts; 20.0 percent of Hispanic immigrants who arrived between 2012-2017 had a bachelor’s degree, slightly higher than the U.S. national average of 19.7 percent for 2017.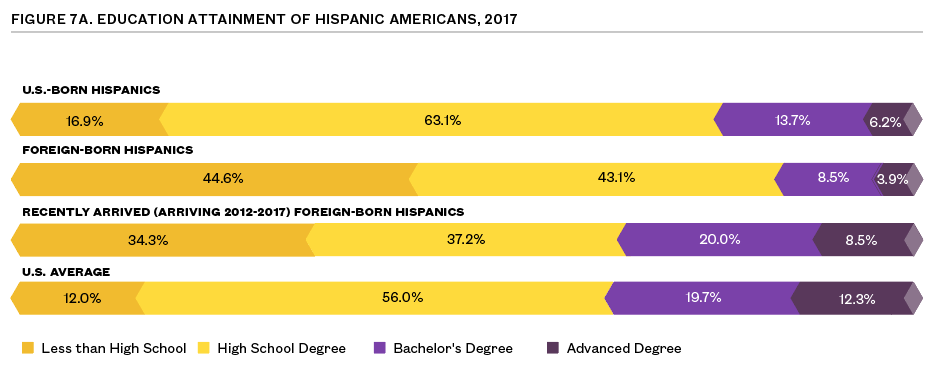
Figure 8: Industries by Share of Workforce Hispanic and Hispanic Immigrant, 2017
By virtue of their size and the variety of skills they hold, Hispanic Americans are important contributors to the U.S workforce and to the economy. In 2017 alone, Hispanic American households, regardless of nativity, earned more than $1 trillion and paid more than $250 billion in total federal, state, and local taxes. After taxes, Hispanic households were left with more than $780 billion in spending power—money to spend on housing, groceries, entertainment, and other consumer goods and services, further stimulating their local economies. Hispanic immigrants, for their part, earned almost half of the total income of Hispanic Americans, more than $472 billion in 2017. This allowed them to pay nearly $110 billion in total taxes and left them with $362 billion in spending power.
These latest numbers show how quickly the earning and spending power of Hispanic Americans is growing. Since our last report on Hispanic American spending power, total annual income earned by Hispanics has increased by more than $94 billion in just 2 years. The consumer power of Hispanic Americans has grown so much that marketing to Hispanic consumers has itself become a growth industry. Felipe Korzenny, founder of the Center for Hispanic Marketing Communications, says the Hispanic marketing industry has at minimum doubled in the last decade to close to a $10 billion industry as businesses strive to attract the Hispanic consumer. “Companies that understand the market continue to do relatively well,” he says.
Korzenny cites the example from Nissan Southwestern Dealers of Arizona and California. After experiencing a dip in sales despite a strong market, the group launched a campaign aimed at Hispanic consumers. Sales increased 31 percent the first year of the campaign and by the second year were 87 percent higher than other dealers in the region. Given that Nissan manufactures more than 1 million automobiles annually in the United States and employs more than 22,000 Americans, “Obviously the entire economy benefits from the Hispanic market,” says Korzenny.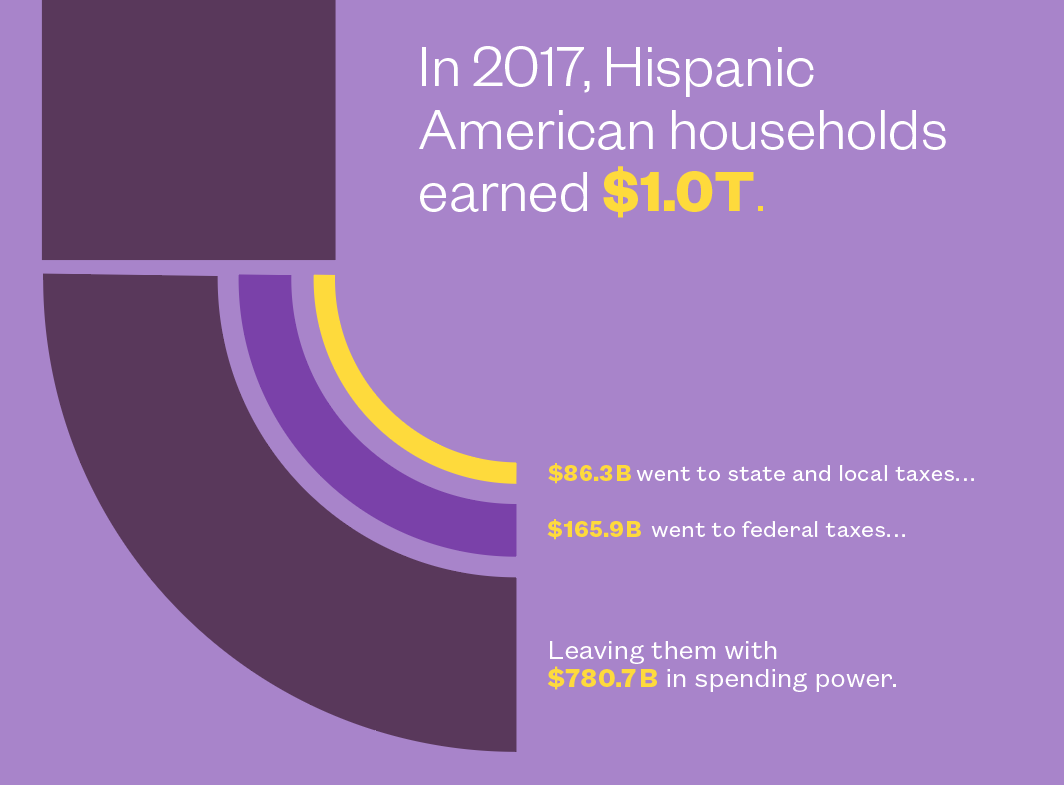
Figure 10: Hispanic Spending Power (in millions of $USD), 2017
| Household Income | Federal Income Taxes | State and Local Taxes | Spending Power | |
| All Hispanic | $1,032,957.8 | $165,878.0 | $86,330.0 | $780,749.8 |
| —U.S.-Born Hispanics | $560,740.5 | $96,297.3 | $46,189.2 | $418,254.0 |
| —Hispanic Immigrants | $472,217.3 | $69,580.7 | $40,140.9 | $362,495.8 |
In some states the share of spending power held by Hispanic households was particularly high. In New Mexico, more than one out of every three after-tax dollars was held by Hispanic households. In Texas, almost one-quarter of residents’ spending power was held by Hispanic households. And in California, Hispanic households held one in five dollars in spending power, or more than $208.2 billion.
In just three states alone, California, Texas, and Florida, Hispanic households paid a combined total of $43.8 billion in state and local taxes and a combined $89.8 billion in federal income taxes. In these and other states, taxes paid by Hispanic Americans, whether U.S.- or foreign-born, are vital to funding municipal services and shoring up social programs like Medicare and Social Security.
Figure 11: Income, Taxes, and Spending Power, Hispanic Households by State, 2017
Hispanic Americans and the Construction and Agriculture Industries
Hispanic American workers continue to play outsize roles in several major U.S. industries. Most notably, Hispanic workers in construction and agricultural industries are vital to filling workforce gaps at a time when demand for labor is high but the supply of available workers is nearing all-time lows.
In 2017, Hispanic Americans made up 29.1 percent of the workforce in construction, a $1.3 trillion industry that makes up 4 percent of the United States’ GDP and also drives demand in related industries such as manufacturing and mining.
The Hispanic American construction workforce is also a heavily immigrant one—more than two out of three Hispanic construction workers in 2017 were immigrants. Overall, this means that 1 in 5 construction workers nationwide are Hispanic immigrants.
Far from taking opportunities from U.S.-born workers, data show that Hispanic immigrants are helping to fill significant labor shortages on construction sites. “Eighty percent of our members tell us they’re having a hard time finding qualified workers,” says Brian Turmail, a spokesman for The Associated General Contractors of America (AGC), a trade group with 27,000 firms in every segment of construction except private homes. “The Latino population is an essential component of the construction industry in just about every part of the country.”
The AGC would like the federal government to expand the temporary worker program to provide more non-immigrant visas in construction and to create a path for working, law-abiding undocumented immigrants who are already here to attain work permits, a move the AGC says would help raise wages of all American construction workers by preventing underbidding by contractors who are underpaying undocumented workers. “We think we should be legally allowing more people with construction experience into the country,” says Turmail.
The AGC has also joined other national construction trade associations in urging Congress to extend Temporary Protected Status (TPS) designations for individuals from countries like El Salvador and Honduras. New American Economy estimates that of the 300,000 individuals with TPS, almost 47,000 work in the construction industry. “Taking away tens of thousands of construction workers at a time when the industry is struggling to find workers is economically dangerous,” Turmail says.
“If you think about construction, we don’t really
do anything as an economy that doesn’t involve building something first,” he
says. “Without people to do the work, we don’t have any economic activity and
we don’t have any infrastructure.”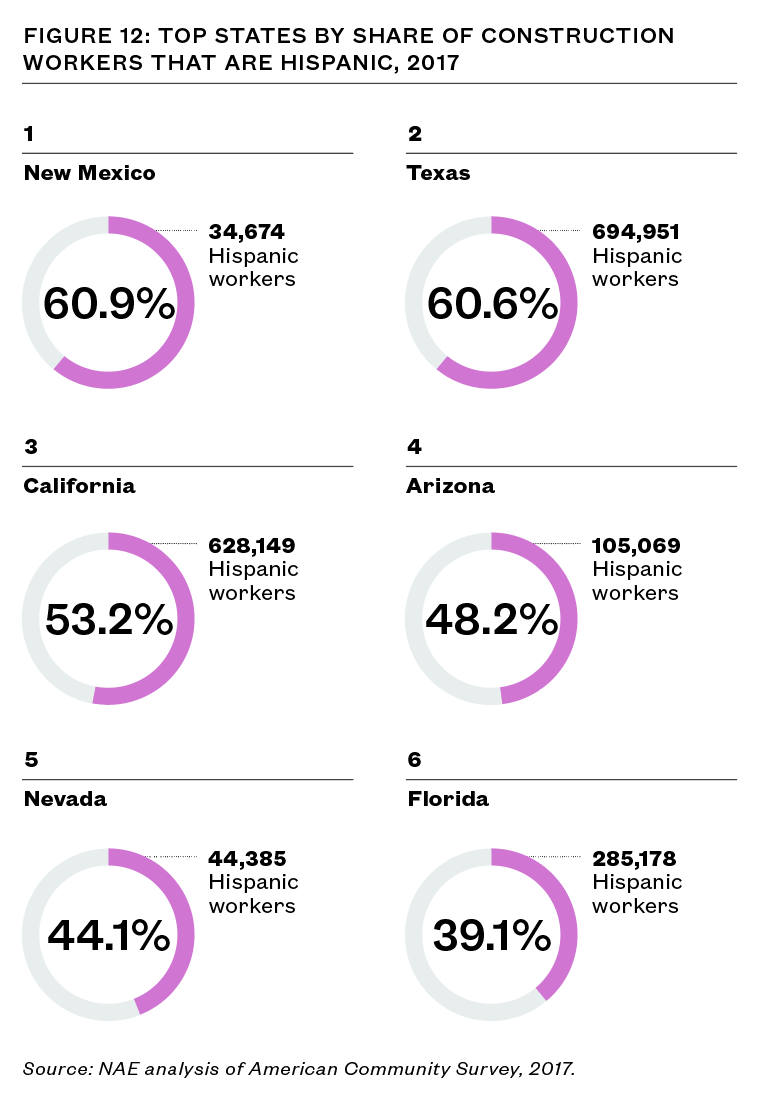
In some key states, such as Texas, New Mexico, and California, Hispanic Americans make up more than half of the construction workforce. In Texas, the state’s construction industry has been experiencing some of the lowest unemployment rate in several years. A 2019 AGC survey found that 84 percent of Texas construction firms reported difficulty filling hourly jobs despite offering average pay that is higher than that of other jobs in the area. The report also found that Hispanic Americans were vital to the industry, making up three out of every five workers at Texas job sites.
Jonathan Escalante says his Round Rock, Texas, company is not alone in being unable to even bid on some jobs, including a 2016 airport project that would have required 60 workers. “We had to turn down the job because we knew we weren’t going to find 60 people,” he says.
At Chamberlin Roofing & Waterproofing, in Houston, CEO John Kafka has been trying for years to recruit U.S.-born workers into the construction industry, with little success. “People just don’t want to do this type of work. Young people aren’t entering the field,” he says. “It’s just not a good situation.”
The U.S. agriculture industry has also faced serious labor shortage
issues for years. Past NAE
work has found that without immigrant workers to help harvest
and plant crops, U.S. farmers would be forced to scale back production or,
worse, let ripe produce rot in the fields. To make up the shortage of
interested workers, many U.S. farmers have come to rely on foreign-born, as
well as local, Hispanic workers to help keep their farms running. By 2017, one
out of three agricultural workers, or more than 1.9 million, were Hispanic, the
vast majority of whom were born abroad. 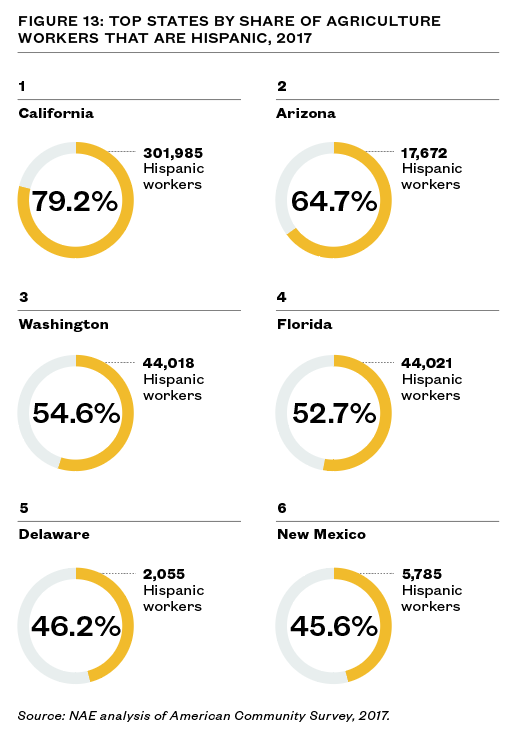
Laurie Swanson, who works at the Michigan Farm Bureau helping American farmers apply for H-2A visa workers, is intimately familiar with the migrant worker’s perspective: Her parents were migrant farm laborers from Mexico. Growing up, she and her siblings would join them, leaving their home in Texas to pack blueberries in Michigan from April to November.
“I remember going to the grocery store and seeing the blueberries that we had packed and my mother saying, ‘Look, we did this,’” Swanson says. “There was a level of pride in that. For me it connected that this isn’t small, the blueberries are going global.”
The migrant workers can see that pride, as can the Michigan farmers she often assists with translations and other cross-cultural issues that may arise. “It’s vital,” says her boss, Bob Boehm, manager of Great Lakes Agriculture Labor Services. “To communicate very effectively in English and Spanish is not easy to find.”
Swanson, who earned a degree in food industry management, has no doubt she wants to continue to help American farmers. “I knew there was a struggle to find labor,” she says. “I want to help employers find workers because I know the impact they have in the country and in the world. They’re basically feeding the world.”
In some key states for agriculture, such as California, Arizona, Washington, and Florida, Hispanic Americans comprised more than half of the agricultural workforce.
On California farms, for example, where more than one-third of the country’s vegetables and more than two-thirds of its fruits and nuts are grown, four out of every five agricultural workers were Hispanic in 2017.
“First you have to recognize that the majority of the crops that we have in California — and there are like 250 different crops — are labor intensive,” says Charlie Wolk, who owns and manages dozens of avocado groves in Southern California. “It all requires labor. So, without that labor a good portion of the country would go hungry.”
“That’s why we in California agriculture have spent so much time, effort, and money trying to get our government to come up with a program to legalize the foreign-born labor force — to fill our labor needs,” he says.
Any action will likely not be soon enough to save this year’s avocados, however. Wolk, a former chairman of the California Avocado Commission, said despite a smaller crop this year, California growers appear to be short the field labor they need to pick all the fruit from the trees.
“They’ll go on the ground,” he says. “It’ll impact the price of avocados ultimately, and it will impact the consumer’s ability to buy a California avocado,” Wolk says. “But they’ll probably be able to buy ones from Mexico and Peru.”
Hispanic Entrepreneurs
In addition to their role as workers, Hispanic Americans also boast some of the highest rates of business ownership in the United States. Entrepreneurship is one of the most important drivers of economic prosperity in the country as the lion’s share of new jobs created each year are at new or young businesses and firms. As entrepreneurs, Hispanic Americans create jobs and increase tax revenues. In 2017, 11.9 percent of Hispanic immigrant workers were self-employed, compared to 9.6 percent of the overall U.S. population. In other words, Hispanic immigrants were 24.5 percent more likely to have their own business than the overall U.S. population.
In 2017, there were 1.5 million Hispanic immigrant entrepreneurs, making up more than half of the almost 3 million Hispanic entrepreneurs in the United States. Seen another way, although Hispanic immigrants made up only 6 percent of the U.S. population in 2017, they comprised 9.9 percent of the country’s entrepreneurs. The latest data from the U.S. Census Bureau’s Survey of Entrepreneurs provides more information on how significant this entrepreneurial streak is for the U.S. economy: In 2016, Hispanic-owned businesses in the United States took in more than $408 billion in sales and employed almost 2.8 million people.
Figure 15: Share of Entrepreneurs, Hispanic
| Non-Hispanics | U.S.-Born Hispanics | Foreign-Born Hispanics | |
|---|---|---|---|
| Share of Entrepreneurs | 85 | 6 | 10 |
Some states have particularly high numbers of Hispanic entrepreneurs. In five states, more than one out of every four entrepreneurs were Hispanic in 2017, making them particularly powerful drivers of economic growth in those areas. California and Texas were home to about 618,000 and 463,000 Hispanic entrepreneurs, respectively; Florida was home to about 313,000.
Rufino Saavedra, an immigrant from Peru, personifies the self-made entrepreneur who has gone on to steadily provide hundreds of jobs for Americans. Saavedra expanded his New Orleans business from a one-man operation into a large-scale painting and restoration company with multiple federal contract jobs under his belt.
After Hurricane Katrina, there was no shortage of construction work in New Orleans. But as thousands of workers — many from Spanish-speaking countries — poured into the city, reputable local contractors who could maintain high standards amid the dizzying pace were at a premium. Among those who came through in the chaos was Saavedra, who oversaw restoration of one of the city’s largest economic drivers — the Ernest N. Morial Convention Center, a 0.6-mile-long building that draws 740,000 visitors and brings $2.3 billion to the Crescent City every year.
“I took the whole painting job,” says Saavedra. After 18 months, his company delivered the convention center, cleaned and restored inside and out, to the city on time—a critical feat given, he says, that the convention center’s schedule was already booked up.
Saavedra launched Rufino’s Painting & Construction in 1990 with his American wife, Wynonne. He had been working for someone else for three months as a painter, but when an apartment manager called him directly with a job request, Saavedra did what he’d always done in a history of 16-hour work days—he said, yes. He picked up supplies and two friends, and from then on became his own boss. Today, Saavedra provides year-round work to more than 100 people, many of whom were born in the United States. Those who were born abroad, many of whom are Hispanic, all have work authorization here in the United States and were the ones who did much of the rebuilding in New Orleans.
Recently Saavedra reached a milestone: More than $100 million in revenue generated over a quarter century. “That’s my contribution as an immigrant,” he says. “That’s a lot of years in business. And it’s not easy. This business can be one of the most difficult businesses to survive in.” In 29 years, Saavedra has never left a job unfinished, even when unexpected cost overruns have threatened any profit for himself. “I fight very hard for acceptance of immigrants in this country, and it’s paying off.”
Hispanic Voting Power
As the number of Hispanics in the United States grows, and particularly as the number of U.S.-born Hispanics age into voting eligibility, Hispanic Americans will make up increasingly large shares of the electorate at a state and national level. By 2017, there were already more than 28.8 million Hispanic Americans eligible to vote, an increase of more than 7 million since 2010. Most of these 7 million were born in the United States, with the number of U.S.-born Hispanics eligible to vote growing from 16.1 million to 21.7 million during that time period, an increase of more than 5.5. million eligible voters. The rest were born abroad and naturalized during that time, earning the right to vote in the next election.
While there were already 7.1 million foreign-born Hispanic eligible voters in 2017, by the 2020 election there could be significantly more: We find that there were an additional 3.7 million Hispanic immigrants eligible for naturalization in 2017 that had yet to apply for U.S. citizenship and voting eligibility. This represents a significant opportunity for candidates and campaigns looking to expand their electoral base.
Voter turnout rate is also high among registered Latino voters. About 80 to 83 percent of registered Hispanics voted in recent presidential elections, based on UnidosUS’s analysis of data from U.S. Census Voting and Registration Reports. For example, 12.7 million Hispanics, or 83 percent of registered Hispanics, voted in the 2016 presidential election, an increase of 1.5 million from 2012. About 26.7 million Hispanic Americans were of voting age, meaning 11.4 million Hispanics were eligible to vote but did not register. Meanwhile, nearly a million more Hispanics Americans turn 18 every year.
The growth in the Hispanic electorate could provide openings for candidates who appeal to Hispanic voters on individual issues they consider important, including immigration. Past research by NAE has found that new Hispanic immigrants — those who have been in the country less than 15 years — express low levels of party affiliation; a 2014 survey found that only 62 percent of these Hispanic immigrants identified as either a Democrat or a Republican, leaving ample room for both parties to make their case to the as-of-yet unaffiliated.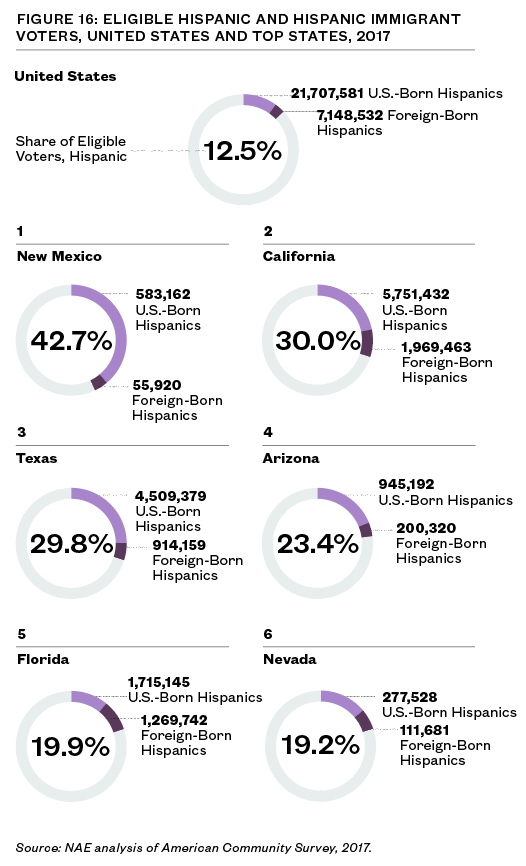
In some states, Hispanic eligible voters already hold considerable power. Although Hispanics make up 12.5 percent of eligible voters nationwide, in New Mexico they make up almost 43 percent of all eligible voters in the state. Meanwhile, in California and Texas, three out of 10 eligible voters are Hispanic, while Florida, New York, and Arizona each had at least 1 million Hispanic eligible voters.
The Hispanic electorate is also expected to be
increasingly influential in congressional elections, especially in swing
districts that have become increasingly diverse. Looking at the 45 closest
swing districts in the country— those with a Cook Partisan Voting Index (PVI)
of +/-3 — NAE found that the Hispanic share of the electorate will increase in
39 districts between 2016 and 2020. Looking at all 45 districts together, we
find that the Hispanic population is expected to increase as a share of the
total electorate by 1.3 percent over those four years.
Conclusion
This year’s look at the contributions of Hispanic Americans shows again just how important a role they play in the U.S. economy and for American society writ large as workers, taxpayers, and consumers. With earnings of more than $1 trillion each year and tax contributions of more than $252 billion, Hispanics not only add significant value to the U.S. economy but they also support and help fund social services and infrastructure that ultimately benefit all Americans.
As Hispanic Americans and immigrants continue to settle and establish even firmer roots in the United States, their contributions are only expected to increase. As Hispanics continue to disperse throughout the country, more communities around the nation will be able to benefit from their hard work and productivity. Meanwhile, the fully untapped power of Hispanic voters presents a real opportunity for candidates and elected officials. Politicians who embrace sensible immigration and other policies that encourage the contributions of both new and established generations of Hispanic Americans may be able to appeal to Hispanic voters traditionally unbound to a single political party, potentially altering the electoral playing field for years to come.
Since turnout rates are high among Hispanics, the second fastest-growing segment of the electorate, investments in voter registration among Hispanics are also critical to increase Hispanic voting participation. Yet, of the ever-increasing expenditures in election cycles, very little goes toward voter registration. The importance of these investments becomes more acute with nearly one million Latino Americans turning 18 every year. As this report finds, Hispanics are already shaping the country’s economic and political landscape; efforts to close the registration gap among Hispanics will further strengthen their voice.