Remembering Ellis Island’s Busiest Day: How Has Immigration Changed Since 1907?
Date: April 16, 2019
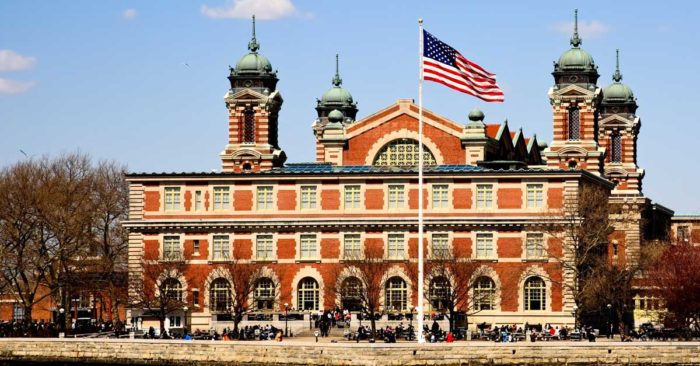
On April 17, 1907, thousands upon thousands of immigrants filed through Ellis Island’s Registry Room, a room no larger than two high school basketball courts. By the day’s end, they had set the record for the number of immigrants processed in a single day—11,747. By the end of the year, more than 1 million other immigrants would join them in starting new lives as Americans. And today, more than 110 years later, tens of millions of Americans today can claim to be their descendants.
The trajectory of the 1907 immigrants seems simple. They were eager to put down roots, achieve the American Dream, and raise their children and grandchildren as fully fledged Americans. But, things were not so simple or straightforward.
Then, as now, immigration was a highly controversial topic. Aspiring Americans didn’t need much in 1907—there were no visas or papers, and the immigrant share of the U.S. population had climbed from less than 10 percent to more than 14 percent, roughly what it is today. Opponents of immigration raised pointed questions about how new immigrants would fit into America, claimed they would take jobs away from Americans, and fanned the flames of xenophobia.
Today, we know these fears about non-assimilation were entirely unfounded. The descendants of those 1907 arrivals are unquestionably American. Yet, the same myths and fears persist. Immigration critics argue that immigrants today less likely to assimilate and succeed than prior generations of immigrants, including those who came in 1907.
But just how different were immigrants who arrived in 1907 compared to their counterparts who arrived 110 years later in 2017? Thanks to the 1910 Census, we are able to answer some of these questions. Using data from the 1910 Census and the 2017 American Community Survey, we find that:
- Today’s immigrants speak more English. Among immigrants who arrived in 2017, the vast majority of them, 83.8 percent, spoke some English partially or fluently. Meanwhile, nearly half of all immigrants who arrived in 1907 spoke no English at all.
- Today’s immigrants are much more skilled compared to their 1907 counterparts. While only 1.3 percent of immigrants who came in 1907 held professional, skilled, or technical occupations like lawyers and engineers, more than 34 percent of immigrants who arrived in 2017 did.
- Today’s immigrants are much more diverse. In 1907, nearly 9 out of 10 immigrants came from European countries. Meanwhile, in 2017, immigrants came from destinations around the world like China, Brazil, and India. In fact, in 2017, no European country made it into the top 10 countries of origin.
- Today’s immigrants are more evenly spread out between states. More than half the immigrants who arrived in 1907 settled in New York, New Jersey, Pennsylvania, and Illinois. In 2017, while immigrants were far more likely to live in western and southern states—especially California, Texas, and Florida—every state received some new immigrants who arrived in 2017.
What did they do?
Although the economy has changed drastically in the last 110 years, immigrants have always helped drive the U.S. economy by contributing to key sectors in the labor force. While the economy in 1907 was still largely driven by agriculture and small mills and factories—industries that require large amounts of manual labor, almost 80 percent of the U.S. economy today is driven by the services sector, things like retail or wholesale trade, entertainment, and legal or professional services. This shift from more manual to more technical or high-skilled jobs can be seen in both the U.S.- and foreign-born workforce. While only 1.3 percent of immigrants who arrived in 1907 had jobs as professional or technical workers—jobs like engineers, doctors, or lawyers—by 2017, more than 34 percent of immigrants who arrived that year did.
Where did they come from?
In 1907, the overwhelming majority of immigrants were from Europe. More than 19 percent came from Russia, almost 16 percent from Italy, and more than 15 percent from Austria. Mexico and Canada were the only non-European countries in the top 10 countries of birth for immigrants arriving in 1907.
Today’s immigrants come from a much more diverse array of home countries. In 2017, India was the most popular country of birth with more than 13.6 percent, followed by China with 11.9 percent, and Mexico with 10.6 percent. In fact, no European country made it onto the top 10 countries of birth for Immigrants arriving in 2017.
Figure 3: Countries of Birth, Immigrants Arriving in 1907
| Country | Share |
|---|---|
| Russia | 19.0% |
| Italy | 15.5% |
| Austria | 15.0% |
| Hungary | 8.0% |
| Germany | 6.4% |
| Canada | 5.7% |
| England | 4.1% |
| Ireland | 3.6% |
| Mexico | 2.7% |
| Sweden | 2.4% |
| All Others | 17.5% |
Figure 4: Countries of Birth, Immigrants Arriving in 2017
| Country | Share |
|---|---|
| India | 11.2% |
| China | 10.7% |
| Mexico | 10.6% |
| Philippines | 3.5% |
| Canada | 3.4% |
| Brazil | 3.4% |
| Korea | 2.3% |
| Venezuela | 2.2% |
| El Salavador | 2.1% |
| Colombia | 2.1% |
| All Others | 49.5% |
Could they speak English?
Although immigrants who come to the United States today hail from far more diverse array of countries, speaking a wider variety of languages, the data shows that they collectively have a better knowledge of English than their predecessors did. In 1907, nearly half of all immigrants spoke no English. Today, almost 84 percent are partially or entirely fluent in English.
Where did they settle in the United States?
Unsurprisingly, the states closest to Ellis Island had the most immigrant residents who arrived in 1907. New York and New Jersey combined were home to more than 1 in 4 immigrants who arrived in 1907. Many others, however, found their way across the country, especially to the Midwest. By 1910, states like Pennsylvania (13.3 percent), Illinois (8.3 percent) and Ohio (5.5 percent) had welcomed significant numbers of immigrants who had come just three years before, drawn to their growing cities and industries in need of large numbers of workers to keep pace.
Yet today, states across the country are drawing new arrivals. In 2017, warmer, fast-growing states like California, Texas, and Florida are home to almost 4 in 10 of the immigrants who arrived in 2017. Meanwhile, some formerly immigrant-heavy states like Ohio and Pennsylvania have fallen off the top 10 list all together.
Figure 6: State of Residence of Immigrants Arriving in 1907
| State | Share of Immigrants Arriving in 1907 |
|---|---|
| New York | 22.1% |
| Pennsylvania | 13.3% |
| Illinois | 8.3% |
| Massachusetts | 7.9% |
| Ohio | 5.5% |
| New Jersey | 4.6% |
| California | 4.4% |
| Michigan | 3.3% |
| Washington | 2.8% |
| Wisconsin | 2.5% |
| All Other | 25.3% |
Figure 7: State of Residence of Immigrants Arriving in 2017
| California | 17.9% |
| Texas | 10.9% |
| Florida | 10.9% |
| New York | 7.6% |
| New Jersey | 4.7% |
| Illinois | 3.9% |
| Massachusetts | 3.7% |
| Washington | 3.0% |
| Virginia | 2.8% |
| Michigan | 2.5% |
| All Others | 32.2% |
Conclusion
As we know today, early 20th century fears about immigrant assimilation in the United States did not pan out. Most children and grandchildren of those 1907 arrivals are considered entirely American. Yet, those fears persist today and many immigration critics suggest that current immigrants are less likely to assimilate and succeed than prior generations of immigrants, particularly those who came from Europe. As our data and other research shows, immigrants who came in 1907, while overwhelmingly European, were still less likely than today’s immigrants to have a specialized trade and critically, to speak any English—two factors that are arguably critical for immigrants’ economic and social integration.