Immigration and Agriculture
Date: August 16, 2021
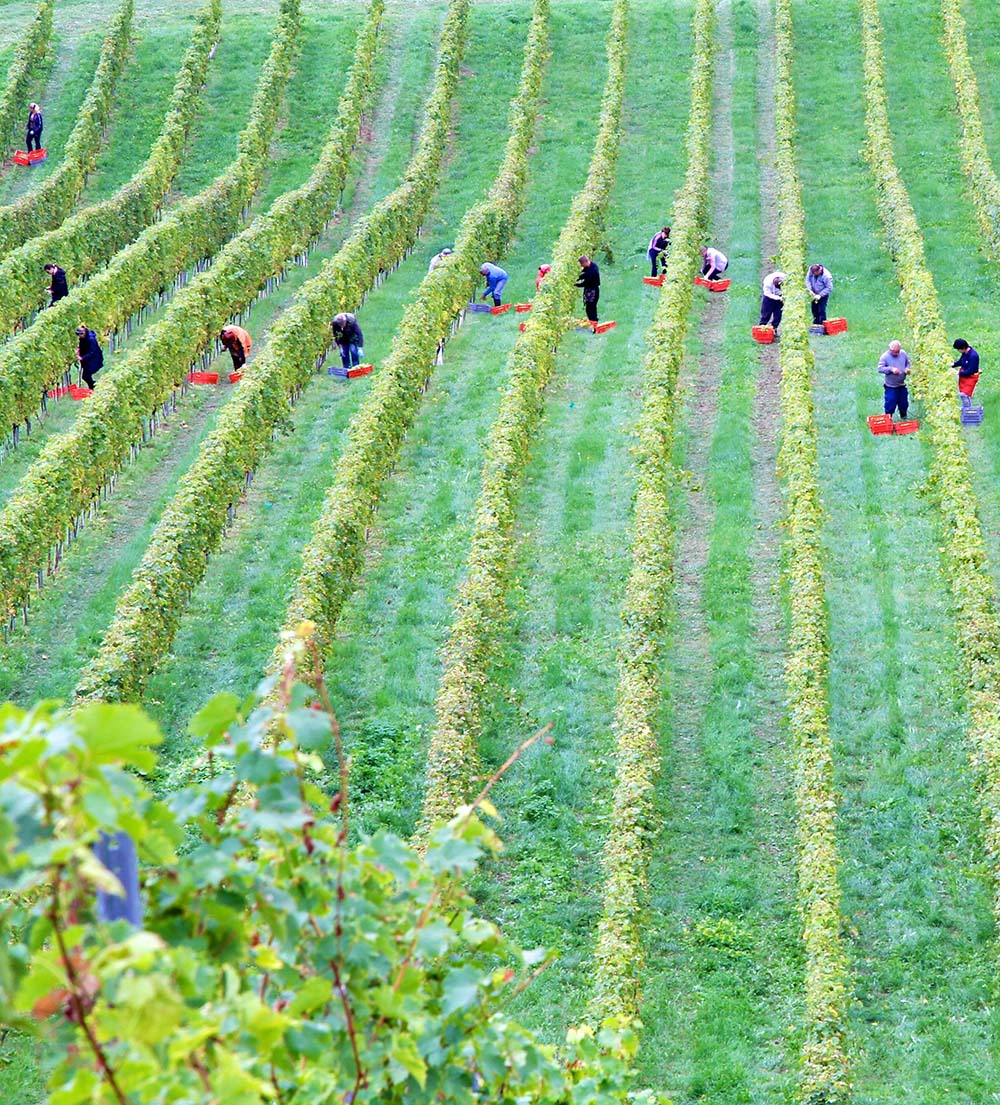
Agriculture is a cherished part of American identity and remains an important part of the U.S. economy. In 2020, the agriculture, fishing, and forestry industries contributed more than $175 billion to U.S. GDP and supported more than 2.3 million workers. The health of America’s farms and the agriculture industry, however, is tied directly to immigration.
- As recently as 2019, almost half—or 48.9 percent—of all agricultural workers were foreign-born and more than one-fourth (27.3 percent) were undocumented.
- Among workers in crop production, the share of foreign-born workers is even higher. In 2019, almost 57 percent of crop production workers were immigrants, including 36.4 percent who were undocumented.
All Agricultural Workers in the United States in 2014 and 2019
| Year | Percent Foreign Born | Percent Undocumented | Total Workers |
|---|---|---|---|
| 2019 | 48.9% | 27.3% | 814,649 |
| 2014 | 53.0% | 35.6% | 796,122 |
Crop Production Workers in the United States in 2014 and 2019
| Year | Percent Foreign Born | Percent Undocumented | Total Workers |
|---|---|---|---|
| 2019 | 57.0 % | 30.9% | 487,562 |
| 2014 | 61.4% | 40.9% | 481,620 |
- In many states where agriculture is especially important, immigrants make up even larger shares of the farm workforce. In California, immigrants make up more than 80 percent of the state’s agricultural workforce. Other states like, Washington State (72.6%), Florida (65.4%), and Oregon (60.7%), also have higher than average shares of immigrants in their agricultural workforce.
Agriculture Workers by State, 2019
| State | Percent Foreign Born (2019) | Percent Undocumented (2019) | Total Workers (2019) |
|---|---|---|---|
| California | 80.3% | 40.9% | 242,159 |
| Texas | 44.8% | 27.7% | 44,729 |
| Florida | 65.4% | 42.0% | 43,777 |
| Washington | 72.6% | 46.6% | 42,338 |
| Oregon | 60.7% | 35.4% | 23,617 |
| Wisconsin | 25.8% | 20.8% | 23,207 |
| Michigan | 29.5% | 16.9% | 20,972 |
| Pennsylvania | 24.2% | 15.6% | 20,298 |
| North Carolina | 54.5% | 39.7% | 19,953 |
| Minnesota | 16.5% | 11.0% | 18,766 |
Worryingly, the data suggests that immigrant workers are not being replaced by new, younger immigrant workers.
- While less than 3 out of 10 foreign-born agricultural workers were over 45 years old in 2014, by 2019 this number had increased to 37.5 percent. Meanwhile the share of foreign-born agricultural workers under the age of 25 decreased from 17.1 percent in 2014 to 10.7 percent in 2019.
This is added on to farmers’ perennial worries about finding enough workers as few Americans seem willing to take on the most difficult and physical farm jobs—particularly those harvesting fresh fruits and vegetables. Yet the H-2A visa, the only agricultural visa currently available to American farms, is too expensive and cumbersome to work for many U.S. growers.
- In 2020, the total number of all workers needed by U.S. farms applying for H-2A workers was 314,028. The total number of farm workers certified to work in the U.S. was 275,430. The H-2A visa program provided 87.4% of the labor needs for farms applying for H-2A visas.
- Florida had the highest number of H2A workers, with more than 39,000 in 2020. Other top states include Georgia (27,600), Washington (26,800), California (25,400), and North Carolina (22,000).
Top 20 States with the highest number of certified H-2A farm workers, 2020
| State | Number of Certified H-2A Workers |
|---|---|
| FL | 39,064 |
| GA | 27,614 |
| WA | 26,832 |
| CA | 25,453 |
| NC | 22,052 |
| LA | 11,332 |
| MI | 9,912 |
| AZ | 8,602 |
| NY | 8,482 |
| KY | 6,952 |
| TX | 6,596 |
| SC | 5,942 |
| MS | 5,521 |
| ID | 4,741 |
| TN | 4,656 |
| AR | 4,470 |
| IA | 3,977 |
| VA | 3,940 |
| IN | 3,631 |
| CO | 3,253 |
Inadequate workforces have contributed to sluggish growth in the volume of crops produced in the United States. This is especially worrying as consumer demand and consumption for fresh fruits and vegetables as increased in the past few decades. This has led to a higher reliance on food imports to meet American consumer demands for fresh produce.
- The share of fresh fruits consumed in the United States that were imported increased from just 20.1% in 2000 to 42.7% in 2019.
- For some fruits, the increased reliance on imports is even starker. The share of raspberries consumed in the United States that were imported more than doubled between 2000 and 2019, from 34.9% to 70.3%. Meanwhile, while 3 out of 4 avocados sold in the United States were home-grown in 2000, less than 1 out of 10 were home-grown in 2019.
Share of Fruits Imported to the United States
| Year | Fresh Fruits, Except Bananas | Avocados | Pineapple | Raspberries | Strawberries | Lemons | Oranges |
|---|---|---|---|---|---|---|---|
| 2000 | 20.1% | 25.7% | 76.1% | 34.9% | 5.6% | 5.4% | 3.1% |
| 2005 | 27.6% | 41.0% | 87.7% | 53.4% | 7.1% | 9.7% | 4.6% |
| 2010 | 32.3% | 73.4% | 99.9% | 50.8% | 8.9% | 10.7% | 7.8% |
| 2015 | 37.7% | 81.5% | 99.9% | 52.1% | 12.7% | 14.7% | 12.3% |
| 2019 | 42.7% | 90.8% | 99.9% | 70.3% | 21.6% | 20.1% | 15.4% |
Share of Vegetables Imported to the United States
| Year | Fresh Vegetables | Asparagus | Broccoli | Carrots | Cauliflower | Cucumbers | Eggplants | Leaf & Romaine Lettuce | Radishes | Squash | Tomatoes |
|---|---|---|---|---|---|---|---|---|---|---|---|
| 2000 | 13.3% | 59.0% | 6.6% | 6.4% | 3.6% | 42.6% | 37.7% | 1.4% | 25.9% | 30.9% | 30.0% |
| 2005 | 17.7% | 72.2% | 11.6% | 7.7% | 3.6% | 52.1% | 47.4% | 1.8% | 28.6% | 44.4% | 35.2% |
| 2010 | 24.4% | 89.1% | 13.9% | 13.4% | 7.4% | 61.9% | 61.7% | 2.8% | 33.6% | 52.3% | 53.1% |
| 2015 | 29.0% | 92.3% | 19.5% | 15.1% | 15.3% | 73.6% | 52.5% | 5.0% | 38.4% | 61.4% | 52.6% |
| 2019 | 31.9% | 99.0% | 24.4% | 11.2% | 23.3% | 81.6% | 60.4% | 13.0% | 52.2% | 62.4% | 61.4% |
Increased dependence on imported fruit and vegetable not only decreases American food security, but it also has an economic cost.
- In 2019, U.S. consumers spent a total of $68.6 billion on fruits and vegetables.
- Of the $31.8 billion U.S. consumers spent on fruit, $13.6 billion was spent on imported fruit.
- Of the $36.8 billion U.S. consumers spent on vegetables, $11.7 billion was spent on imported vegetables.